
Lauren Malhoit
History and Audit Trails
One of the biggest reasons admins love modern DDI solutions - centralized history and audit trails
Feb 10th, 2022
If you're using multiple tools to manage your DNS, DHCP, and IP information, collecting change information is a nearly impossible task. Using a modern, centralized DDI solution saves you frustration and time.
A trend I've been noticing lately when I talk to customers is that they often come to Micetro for the IP address management, but they stay for the centralized history and audit trails. There are several ways in which Micetro helps you understand the changes made to your environment, when they were made, and who made them. Most importantly, these methods are simple to use and offer multiple ways to view and share the information.
Recently Created, Recently Modified
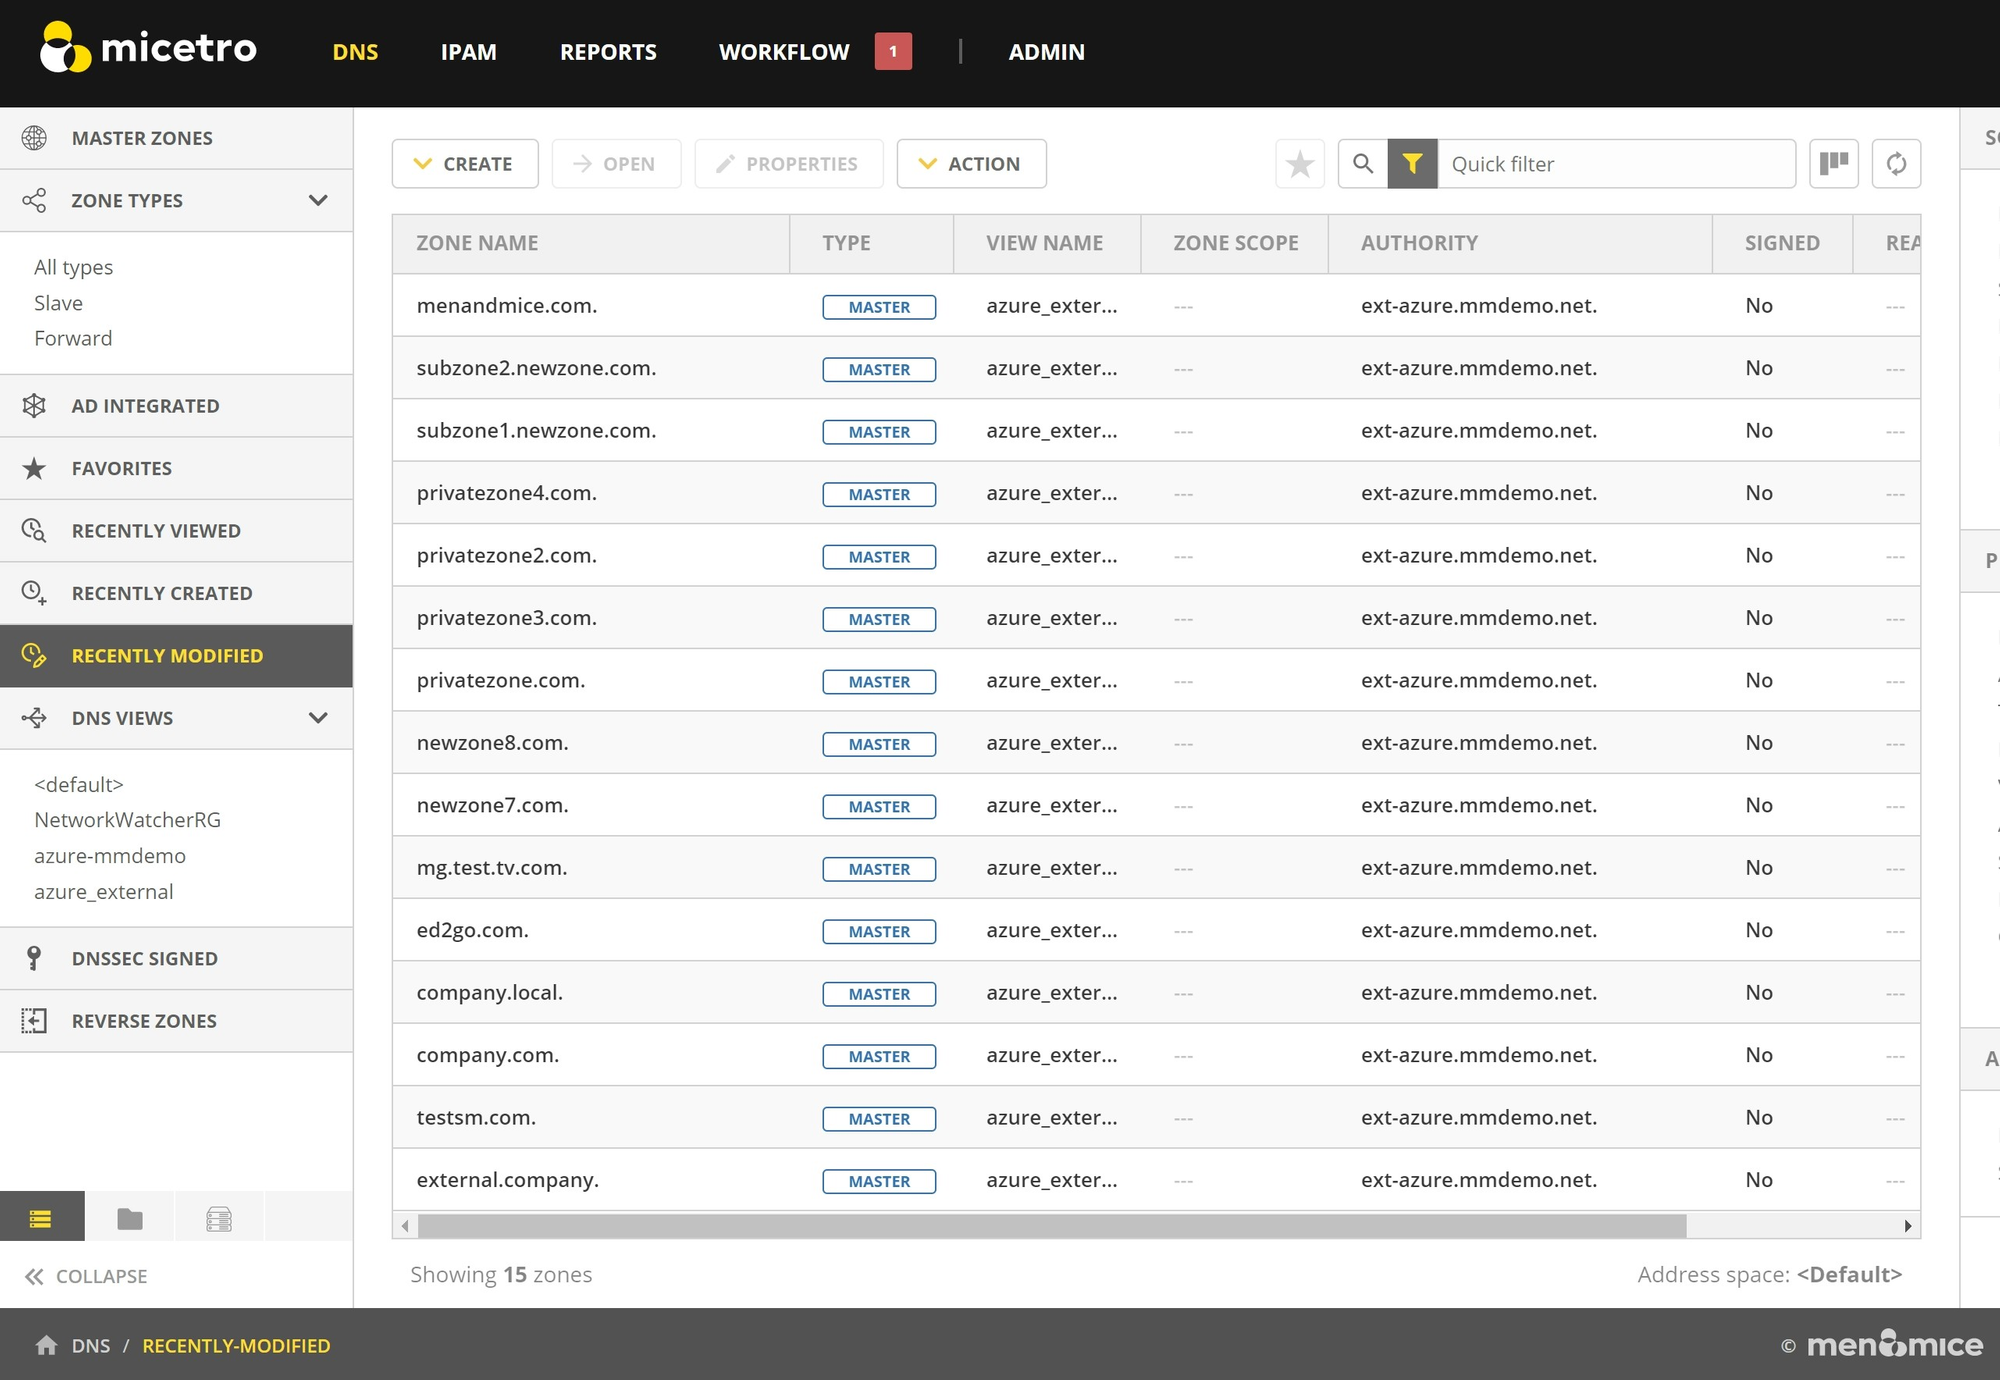
On the left sidebar of the Micetro web UI, both under the DNS and IPAM tabs, there's a menu with several built-in filters. Two of those filters are called Recently Created and Recently Modified. You know that saying..."it must be the DNS." These two buttons exist to provide actual data to help you refute that.
When you click on Recently Created, it shows you all of the DNS, DHCP, or IP objects which were created most recently. If there were some kind of outage or performance issue, you can click on this button to see if an object which was recently added to your DDI environment might be affecting your uptime or performance.
Recently Modified shows something similar, except of course it's a list of all the objects which may have been changed recently. This is for the whole system, so no matter where that change was made and no matter who made it, if you have the right permissions you'll be able to see that object and then view the history to get more information.
View History
Now that you've narrowed it down to some possible suspects for what might be causing an issue, you can view the history of that object to see all kinds of information. By hovering over one of the objects in the grid, you can click on the meatballs menu and select View History to easily get this information.
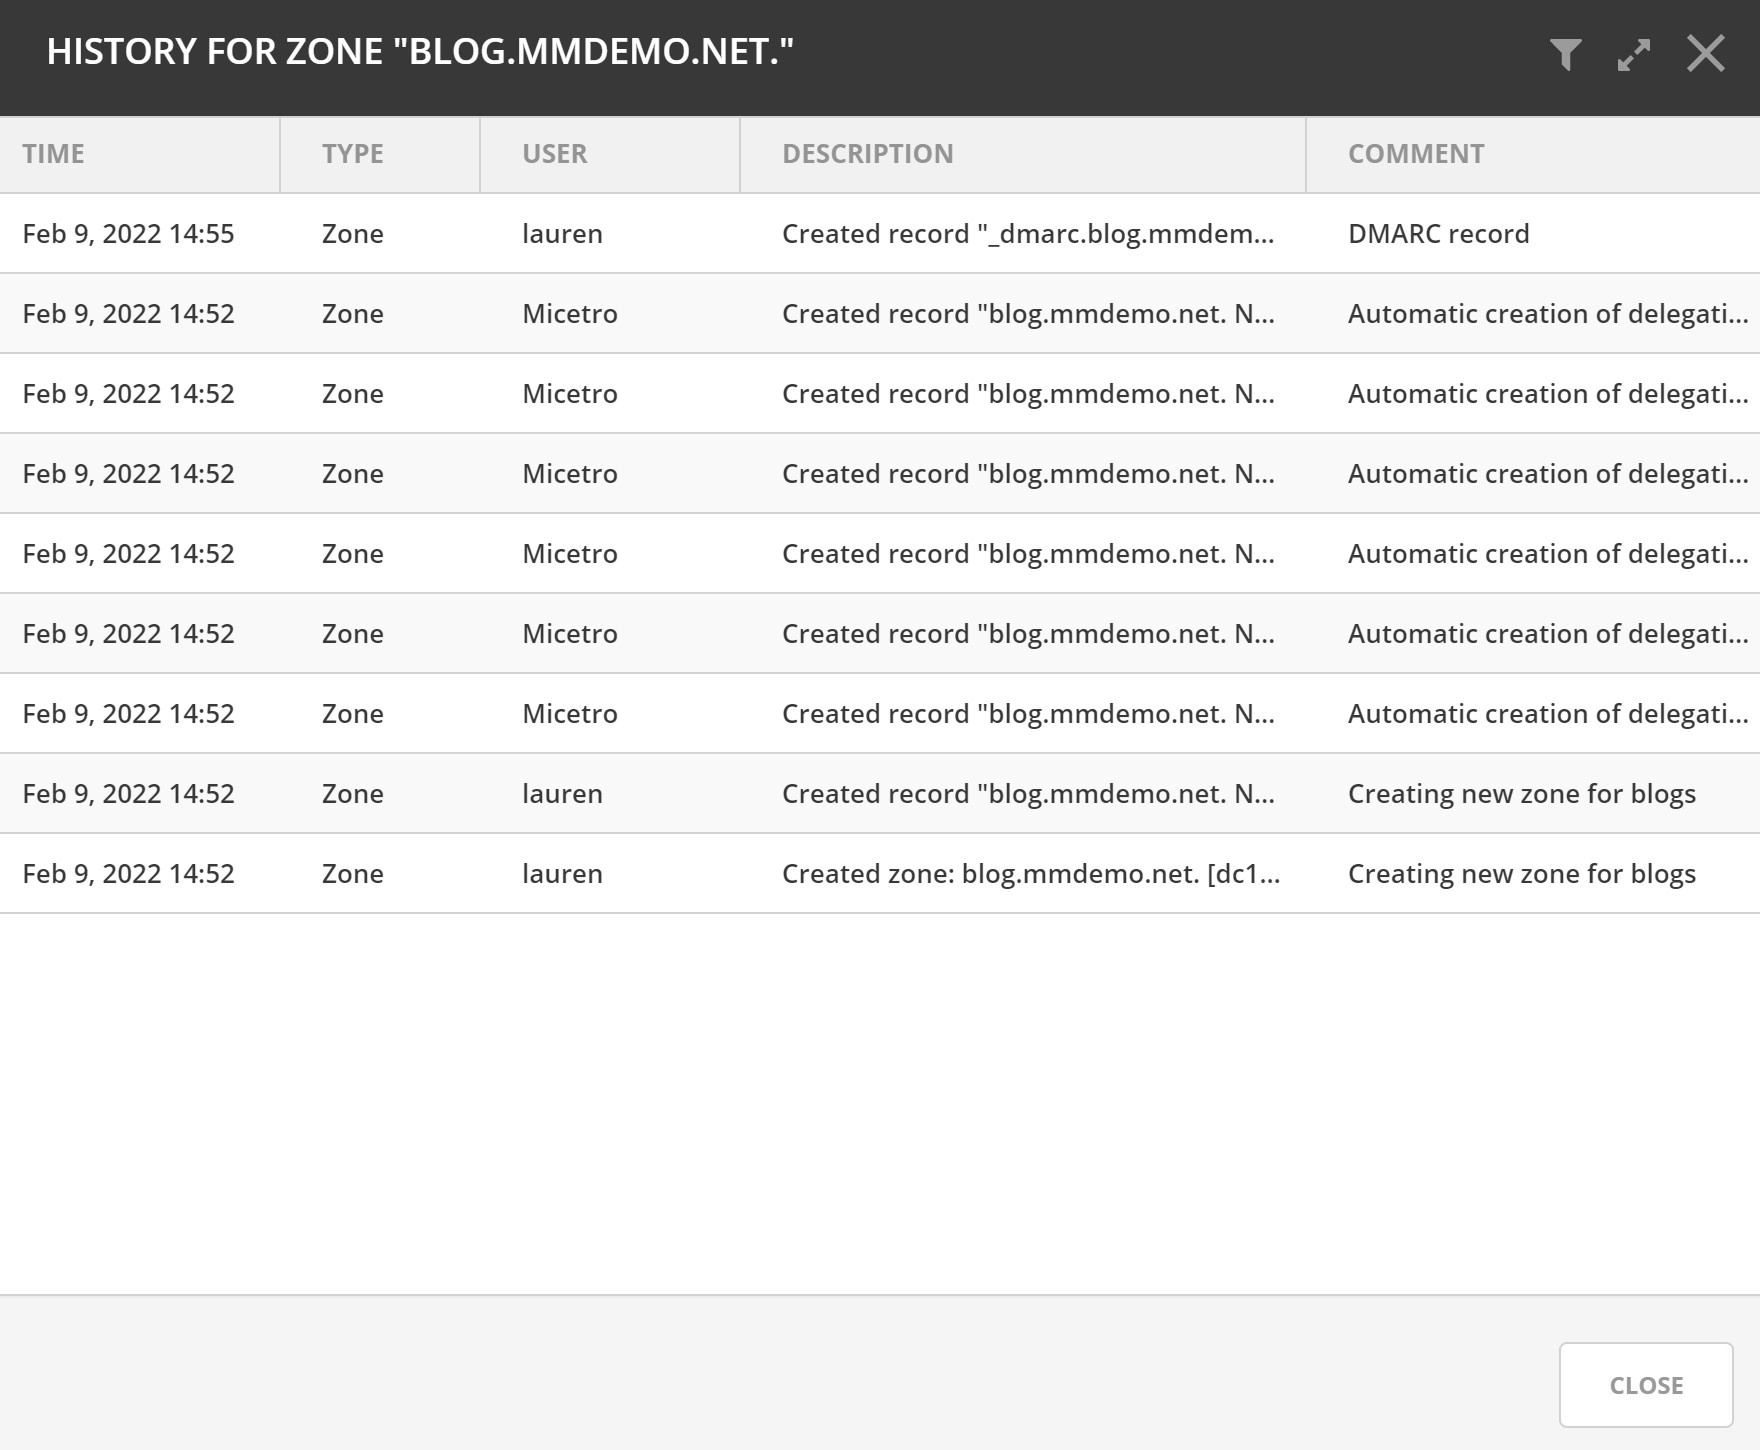
In the above example you can see a record of:
- data and time a change was made
- what type of object to which the change was made
- who made the change
- what the change was
- why the change was made (in the comments section)
APIs
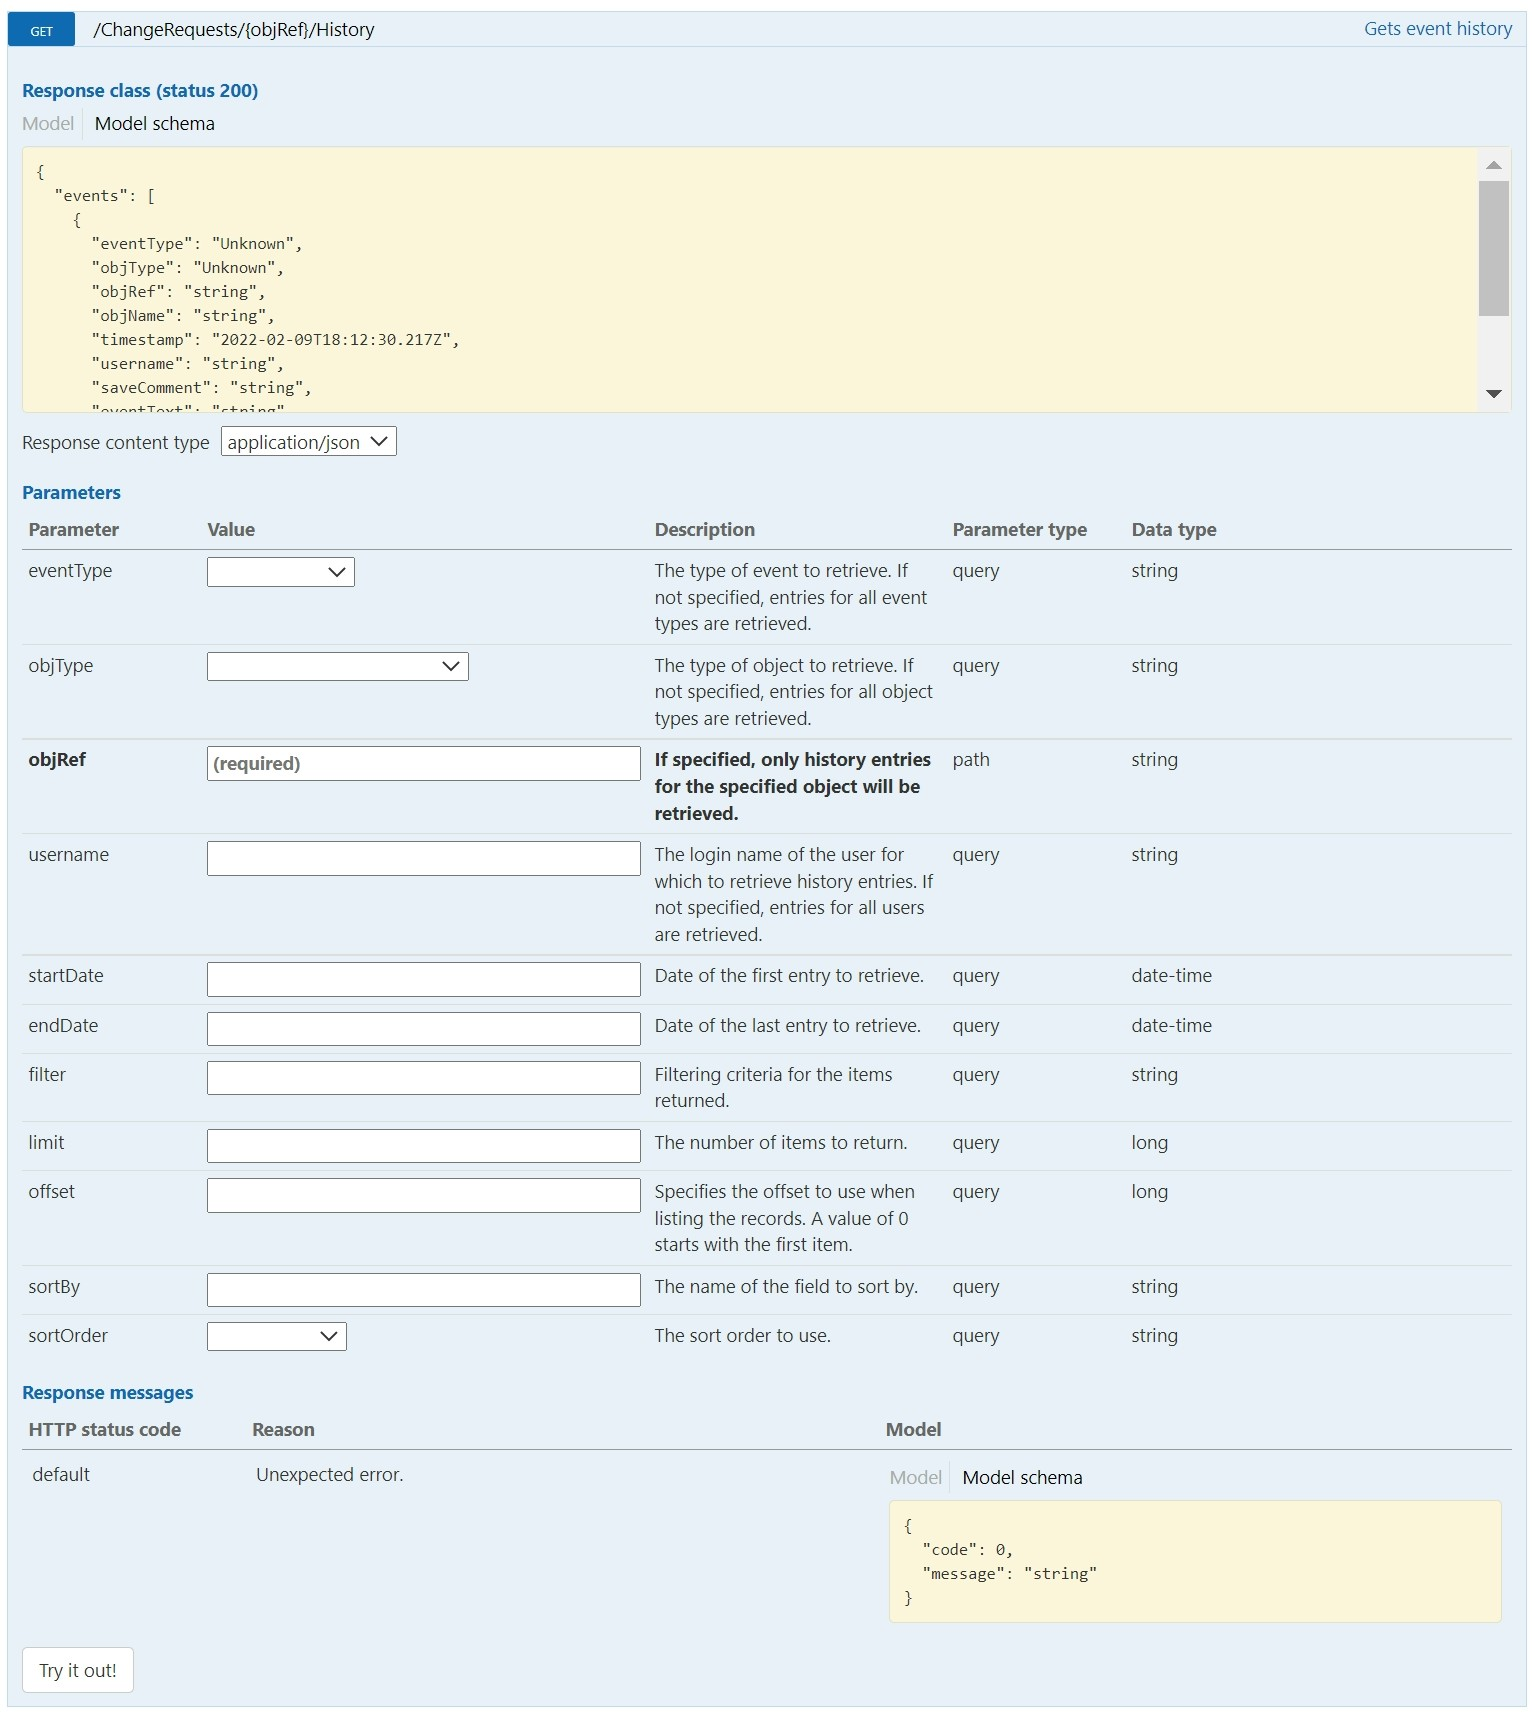
Micetro has robust APIs which will allow you to do any task or workflow which is possible in the GUI. In fact, because Micetro is built with Swagger in the backend, you can even give these tasks a try before you build them into a proper automated workflow.
A central API for your entire DDI environment also makes it much easier to use 3rd party reporting and visualization tools to easily see what's going on in your environment in near real-time. For example, you might use PRTG for your reporting on other systems in your data center or campus. Micetro will plug right in, as a technology partner with PRTG, to give you the contextualized information you need.
Built-in and Custom Reports
Sometimes you just need a report to hand off to someone. Micetro comes with several built-in reports which are easily run and will produce a report in the format you prefer.
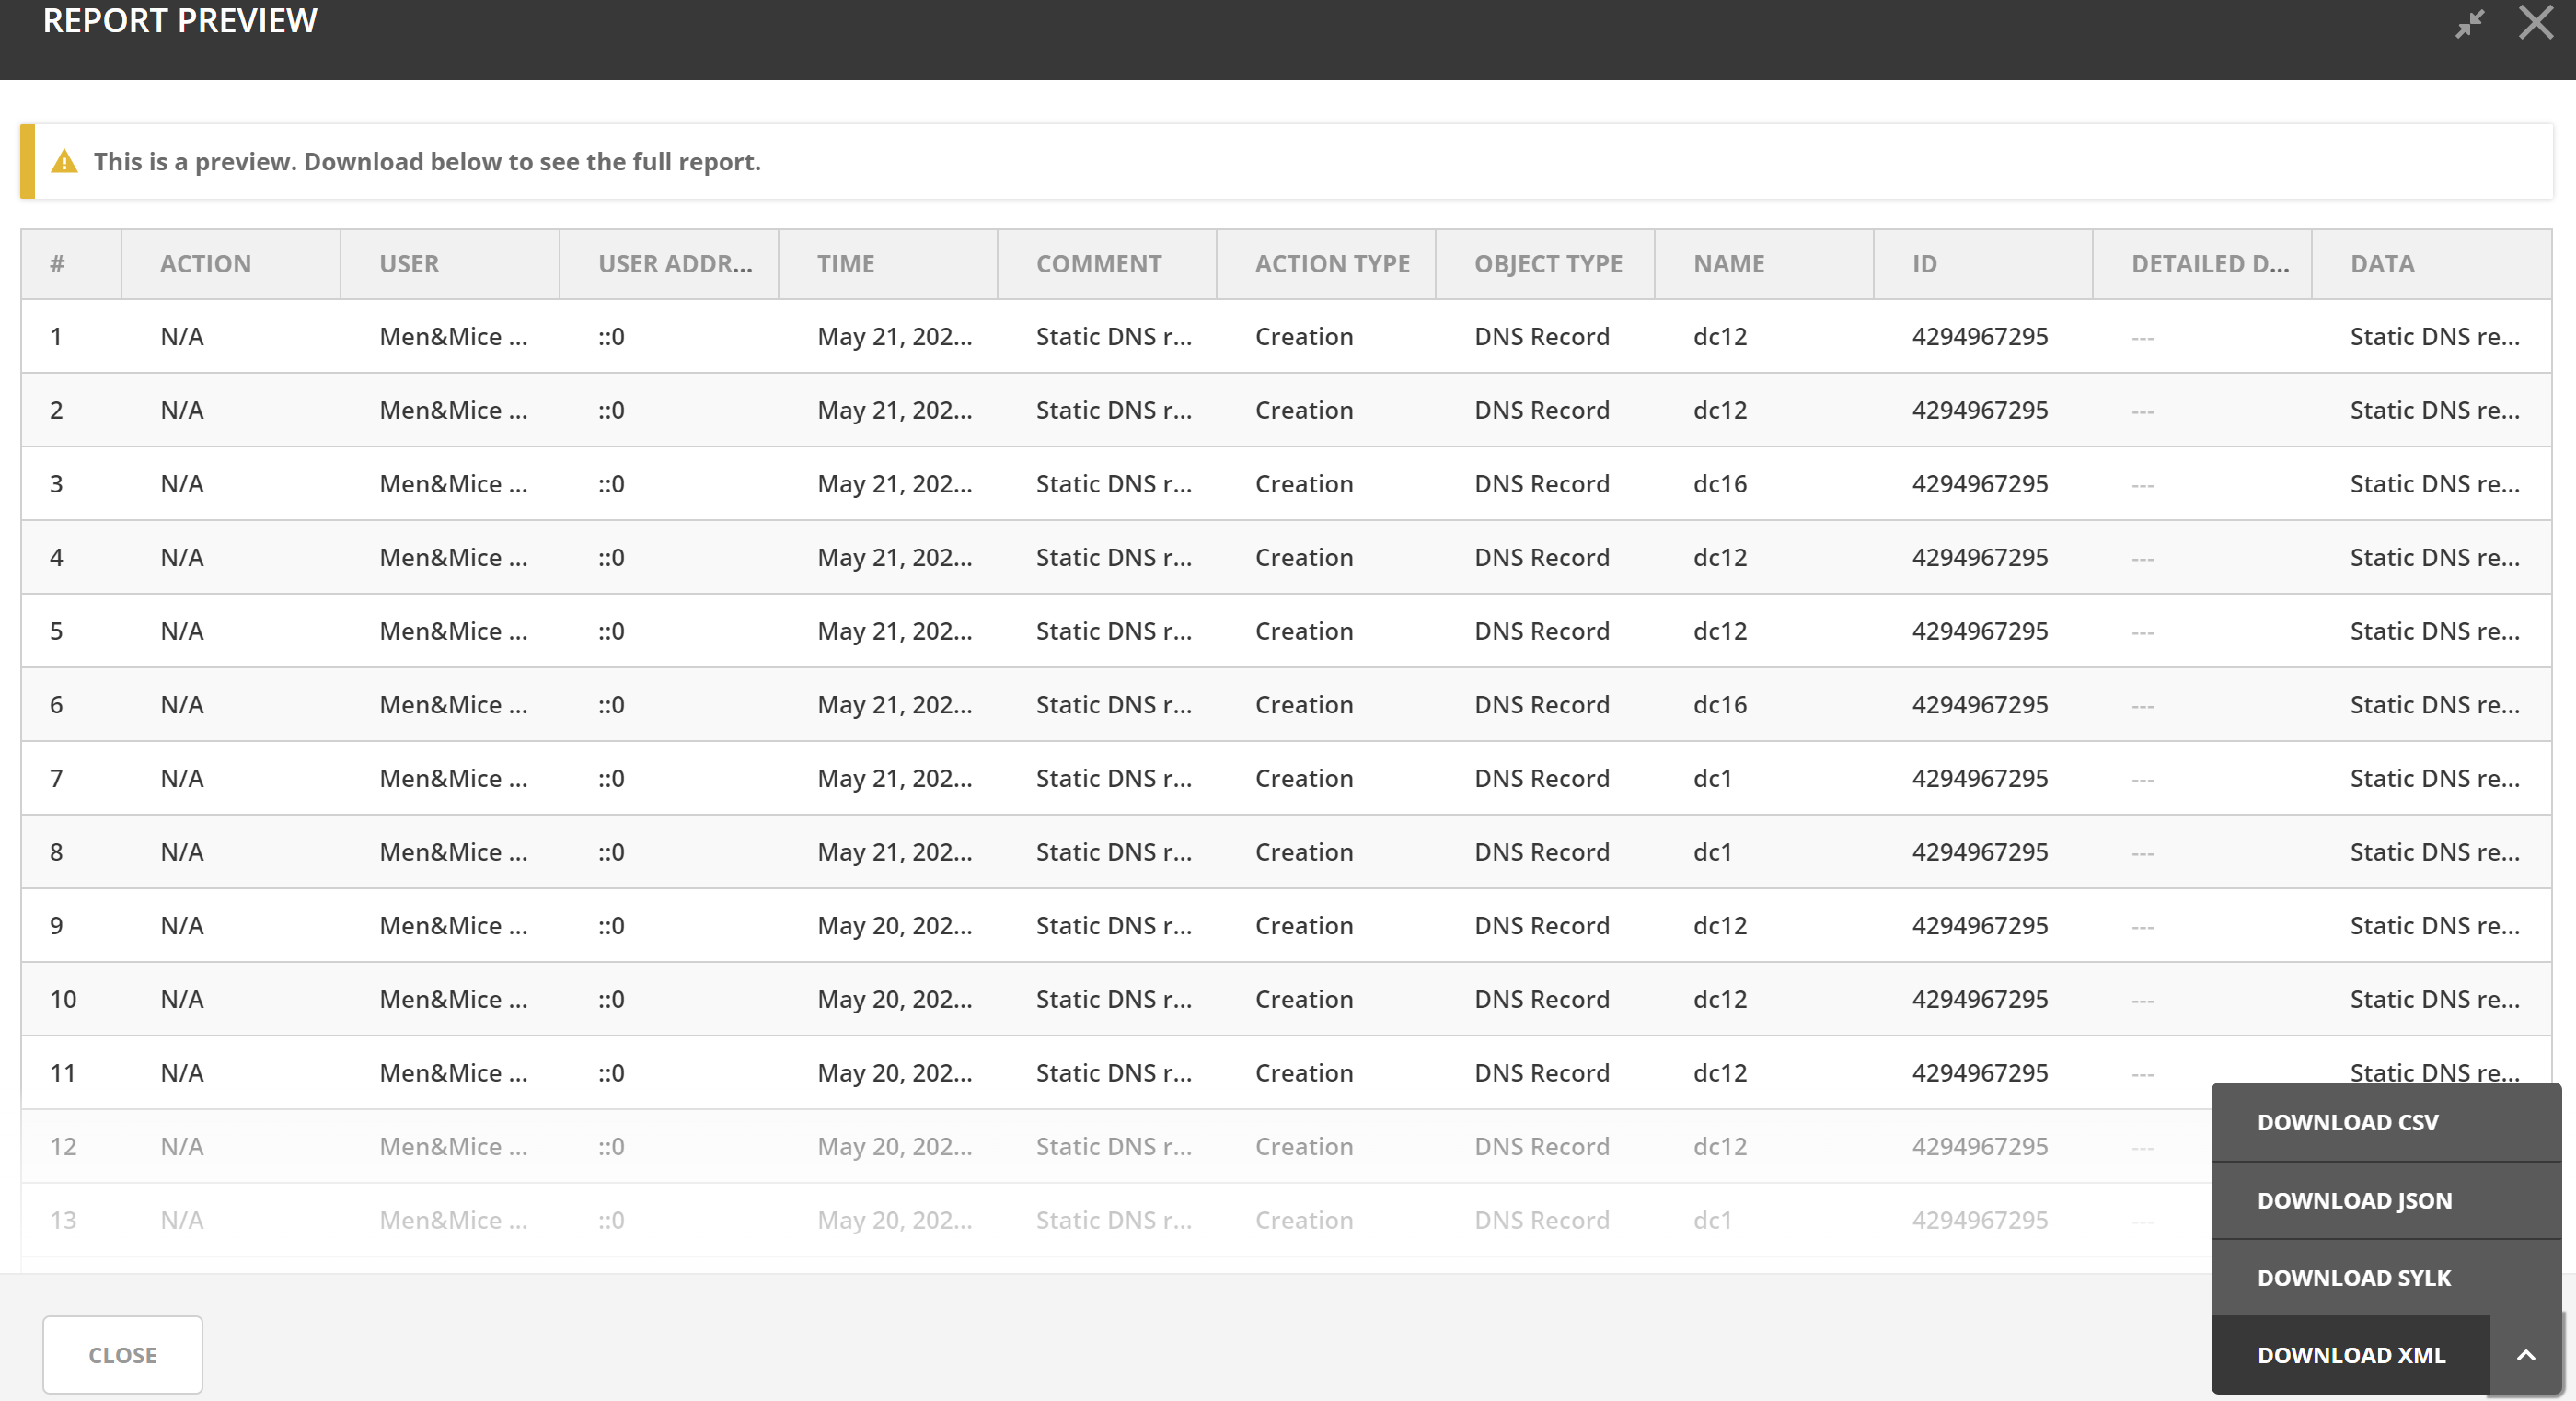
You may also create custom reports with custom fields to get the information you need and when you need it. For more information on custom reporting tool you can check out our documentation here.
Which One to Choose?
Likely depending on your role and who's looking for information, you'll end up using all of these methods of retrieving historical information. When you're looking for information immediately because you're troubleshooting, you might use the Recently Created and Modified filters. View History may also be of help when you're trying to solve something in real-time. Going through the APIs may help you in multiple cases, whether you're trying to solve something now, be proactively alerted about errors, or just getting output for a report or dashboard visualization. Reports will usually be helpful in the realm of auditing and compliance. They might be something you receive weekly or a longer time frame that you turn over to an auditor or your manager.
No matter what the use case, Micetro has you covered. If you have any questions or if you'd like to see a personalized live demo just click here!
