DDI Monitoring and Analytics: Micetro and PRTG
Real-Time Monitoring for Your Heterogenous DDI Environments
Oct 28th, 2021
Dashboards or Reports?
When you ask people whether they would prefer dashboards or reports you always get different answers. That’s not so interesting in and of itself, what’s interesting about it is how passionate people feel about their opinion. If you’re an engineer trying to troubleshoot something, you probably prefer some real-time information from a dashboard, maybe even some SMS alerts. Running a report might feel like you’ve already missed out on new information while you’re trying to troubleshoot something happening now. In other cases engineers may be sending reports to their managers or to auditing consultants and a report is the best way to get that information to them.
Either way, the good news is you don’t have to pick between dashboards and reports thanks to the technological alliance between PRTG, by Paessler, and Micetro, by Men&Mice.

Why the Partnership is so Important
Listen, every vendor wants to think that they’re the be all and end all to all their users’ issues and generally this is based on good intent. The fact is, though, that we all only cover a part of the technology that you’re using in your data centers and campuses. So we need to do better in making sure that you can get contextualized views about what’s happening for your entire infrastructure. Take for example the recent Facebook outage. Everyone blamed the DNS at first, but actually DNS was doing its job. The problem ended up being a routing issue that essentially cut DNS off from the rest of the world. (We’ll reserve the right to talk about DNS redundancy in a different blog)
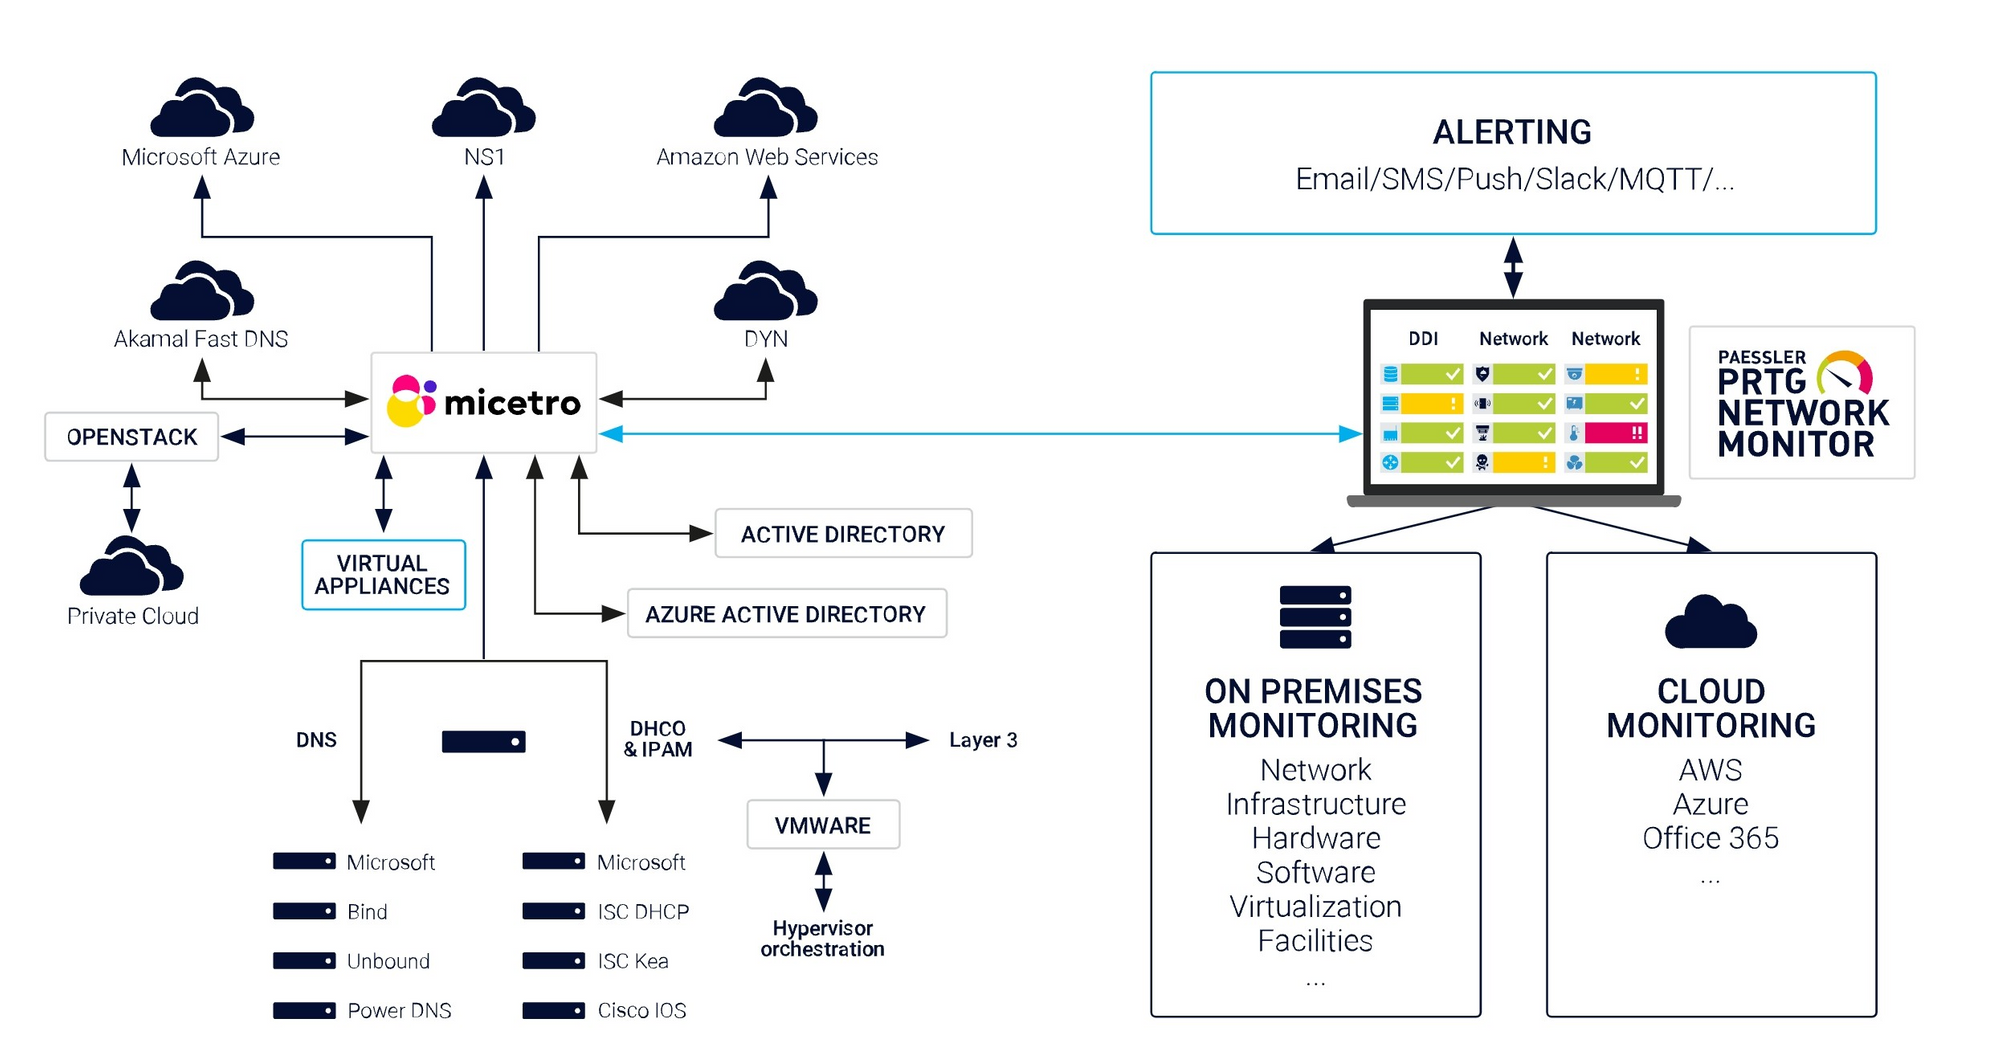
That’s why PRTG and Micetro are such a great pairing. Micetro helps engineers manage and view their entire DDI infrastructure, whether it’s on-premises or in the cloud. It gives you a centralized view to multiple Active Directory Forests, BIND DNS, Route 53 in AWS, Azure DNS, DHCP from multiple sources, and the list goes on. However, you’re not going to get any BGP routing information from Micetro. That’s where PRTG comes in. You’ll get unobtrusive views to all your network, compute, and storage analytics and MIcetro is part of the team that will feed it that information.
How Does it Work?
Micetro is an API-First software solution, meaning anything available in the UI is available via API to our users. This makes for easy integration with ecosystem partners like PRTG. PRTG offers a REST Custom Sensor that can easily be added as widgets likely to your already running PRTG dashboard.
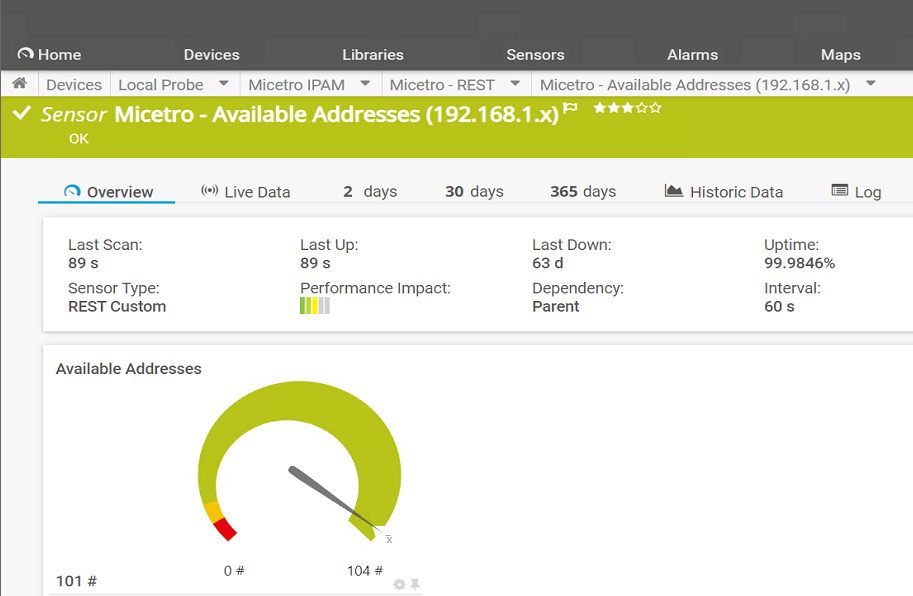
Paessler has even gone ahead and created templates for use with Micetro on GitLab. Here’s an example of one sensor showing amount of available IP addresses.

Now of course, you can see all of your DDI information from your on-prem or multicloud infrastructure along with all of the other information PRTG is gathering from routers, switches, servers, and even things like building monitors and other IoT devices giving you the views you need to maintain and troubleshoot more quickly than ever.
Are You Using PRTG and Micetro?
We’d love to see how you’re using Micetro and PRTG together! Tag us on Twitter or LinkedIn and let us know the cool stuff you're monitoring. We’d love to work with you on making sure you’re getting all the information you need!
For more information from Paessler please check out their blog on the technological alliance or their solution brief recently published as well.